Viewing the Summary:
- Depending on settings selected the Summary may display results by range, time of day, averages, mealtime averages, Test Tracker progress and Awards. You and your healthcare professional can reference the Summary to identify overall trends in your diabetes management.
- NOTE:
- Do Not use result averages to make immediate treatment decisions. Result averages provide information from past results. Always consult your healthcare professional before making significant changes to your diabetes care plan.
- Do Not allow other people to use your meter as it may affect your averages.
- The meter calculates averages based on the 7-, 14- and 30-day periods ending on the current date setting. If you change the date setting, the averages may change too.
- The Summary screens displayed will reflect the features currently selected. For information on turning meter features on or off, see article:
- If Basic Mode is selected, your Summary will be limited to the 30-day Summary and Average views. For more information about Basic Mode, see article:
- In Averages, Pattern Messages and Awards, an EXTREME HIGH GLUCOSE result is always counted as 33.3 mmol/L, and an EXTREME LOW GLUCOSE result is always counted as 1.1 mmol/L.
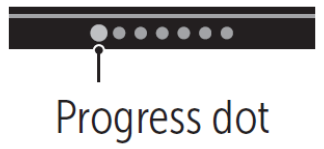
- The green progress dot will move from left to right as you navigate through the summary screens.
-
- Pressing ↑ will display the previous screen
1. From the Main Menu, press ↑ or ↓ to highlight Summary and press OK
-
- The number of results that are low (blue), in-range (green) and high (red) are displayed and appear as bar graphs.
2. Press ↓ to display the Summary by time of day
-
- The number of test results that are low, in-range and high, by time of day are displayed. The four time slots are Morning, Afternoon, Evening and Bedtime. The time frames for the four time slots cannot be changed.
-
- NOTE: If there were no results in the past 30 days in a target range and time period, that section of the chart is left blank.
3. Press ↓ to display your overall averages for the past 7, 14 and 30 days
4. If Basic Mode is off, press ↓ to display your Before Meal averages for the past 7, 14 and 30 days
5. If Basic Mode is off, press ↓ to display your After Meal averages for the past 7, 14 and 30 days
-
- NOTE: If you do not have results in the past 7-, 14- and 30-day periods, dashes will appear in the mmol/L column.
6. If Test Tracker is on, press ↓ to display the Daily Test Goal screens
7. If Awards is on, press ↓ to display the Award screens

